After that, you probably had a question:
So, what's next?
Let's say we trained a model, it finds something, and we even take pride in all sorts of beautiful metrics.
Can we now connect it to the machine, press a button, and say:
Well, that's it, now ML runs the production.
But in a real factory, it's better not to do that at all.
So the next step for me was shadow inference.
To put it simply - the model is already working alongside the real machine, receiving real data and making its predictions. And these predictions are either confirmed or not, and we then see the actual Recall.
But the machine knows nothing about this inference at all.
ML doesn't switch anything, doesn't stop anything, and doesn't write anywhere.
It just sits next to it via API and observes.
From Laptop to Real Machine
Before this, most of the experiments looked pretty much the same: - There are historical data in ClickHouse. - We take the necessary period. - We form a dataset. - We run the model. - We look at the metrics.
The problem is that a real machine doesn't work like that.
It doesn't give you a nice CSV like Kaggle and doesn't say:
Here you go, Ivan/Masha, there was normal operation, and in 30 seconds there will be a defect. Good luck with feature engineering.
In reality, the data stream is constant and continuous, the machine works-stops-starts-changes modes, and God knows what it does.
So there turned out to be a big intermediate step between: I trained the model and I'm using ML in production.
That's exactly what I'm going to talk about now.
What Shadow Inference Means in My Case
The scheme is as simple as possible:
PLC / ClickHouse
      ↓
data
      ↓
ML inference
      ↓
web interface
      ↓
event log
The model receives data and calculates the state.
If it finds an interesting pattern - it shows it in the interface and logs the event.
But there is a fundamental limitation:
there is no way back from ML to PLC at all.
That is, the service cannot:
- stop the machine;
- change the recipe;
- turn on the drive;
- write to the register;
- adjust the process parameter.
In other words, nothing at all.
The maximum it can do is say:
"Something seems suspicious, and I will classify it as a defect since the threshold allows it."
And that's it.
But that's exactly how the model should work during the testing phase.
First, we need to understand how adequate the model is in real life.
And only then give it any levers (although even after understanding, those "levers" are as far away as the moon).
Now the Model Needs to Live Next to the Machine
With historical data, everything is relatively comfortable.
I already know how a specific episode ended. I can take the necessary window, look at the signals before the defect, after the defect, and compare them with normal production.
In the live version, everything is the opposite.
The system receives the next snapshot and doesn't know the future.
Right now, it only sees the state of the machine:
12:42:15 → normal
12:42:16 → normal
12:42:17 → suspicious pattern
12:42:18 → the pattern persists
12:42:19 → ...
And what will happen next is still unknown.
Will there be a defect?
Will the machine return to normal on its own?
Will it stop?
Will the operator change something?
That's exactly what I'm observing now.
Inference Written in Regular Flask
Here, I decided not to engage in architectural rocket science at all.
I don't need React + micro-frontends + Kubernetes + a separate team of frontend developers for a page where I want to see five numbers.
I need to open a browser from my laptop or tablet next to the machine and see something like this:
Machine state: PRODUCTION

CAUSE 1/2    0.84    ALERT
CAUSE 3      0.12
CAUSE 4      0.05
CAUSE 6      0.08
CAUSE 39     0.31
For this, Flask is more than sufficient.
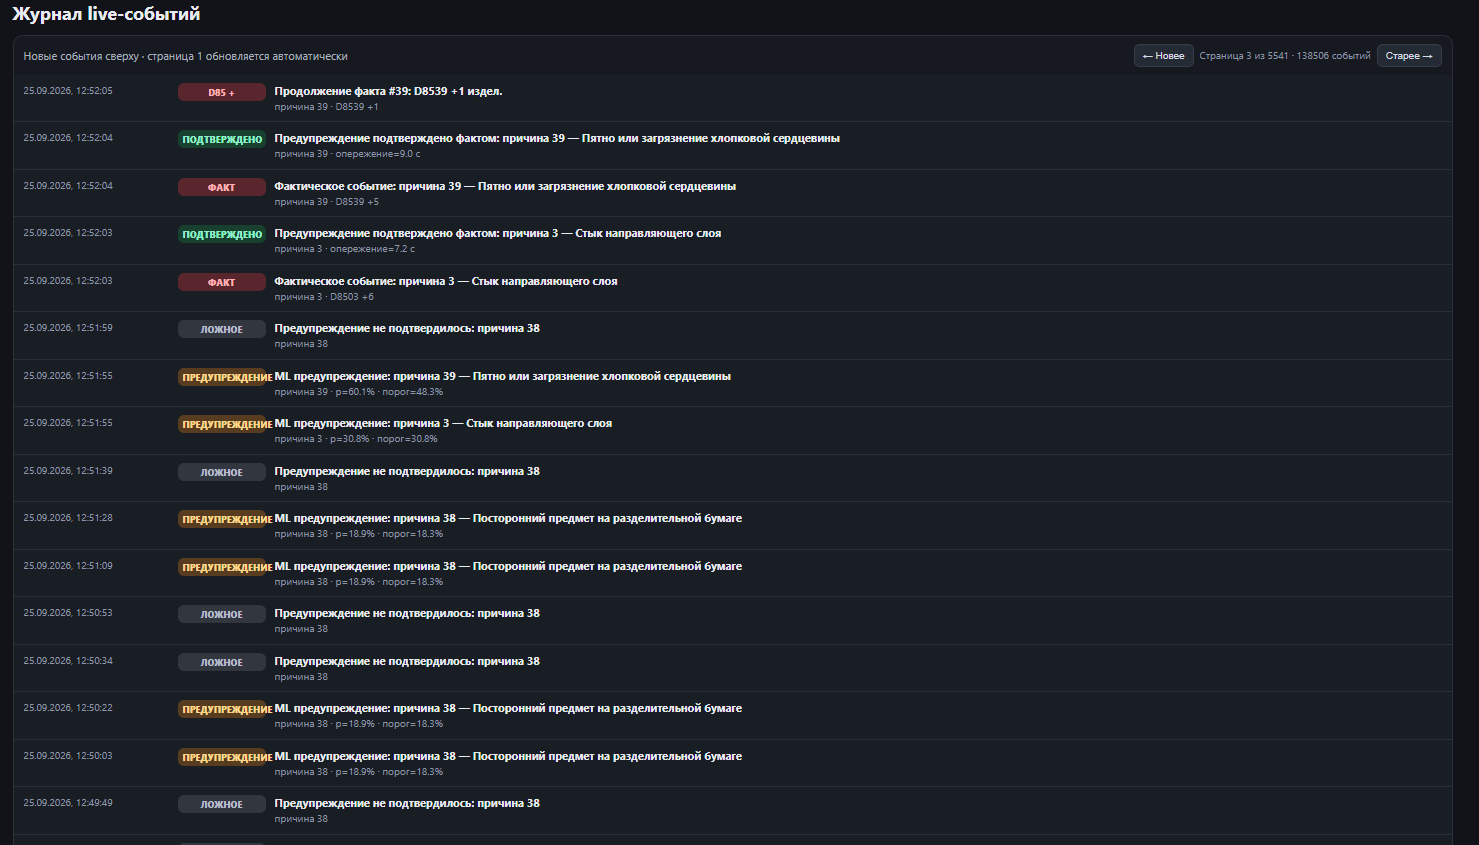
I need to quickly see:
- what the model is currently thinking;
- when a suspicious pattern appeared;
- how long it lasts;
- which signals changed;
- how it all ended;
- and log all of this.
The Main Thing — Don't Turn ML into a Magic "Defect" Button
I really want to write something flashy in the interface:
DEFECT IN 17 SECONDS
or even better:
ARTIFICIAL INTELLIGENCE CONTROLS EVERYTHING (sinister laughter)
And then I can go: * show it to the director. * make a presentation. * sell the startup. * sell toothbrushes/vacuum cleaners/refrigerators/car tires proudly shouting "AI is implemented here" (a nod to modern advertising).
There's just one tiny problem.
The model has no idea what's happening in the real world, let alone talking about any defects.
If historically I see that a certain combination of PLC signals often occurred before a specific cause of defects (and we discussed them in previous articles), then an honest formulation would be:
A state was detected,
historically associated with cause No. 1/2/etc.
Sounds boring, I agree. But it's the truth.
I still don't know whether this pattern means:
a defect will definitely occur
or:
the probability of a problem has increased
This still needs to be verified on the real stream and proven (or disproven). That's what shadow inference is for.
And No "We Predict Defects in N Seconds"
The same goes for lead time.
I really want to say:
"Our system warns about defects 10-30-100 seconds in advance."
Sounds nice, but it has little to do with reality.
In different production episodes, the pattern may appear at different times.
The model saw the pattern:
prediction_timestamp
We recorded it.
Then we continue to observe the production.
If a corresponding reject actually occurred, we save:
prediction_timestamp
actual_event_timestamp
actual_cause
lead_time
If no defect occurred later — then it's a candidate for a false alarm. And we also log that.
And when we accumulate enough of such cases, we can properly calculate:
- average lead time;
- median;
- variance;
- number of false positives;
- how many real events the model actually caught.
And only then write beautiful numbers in presentations and for the marketing department =)
What Resulted in the End
Now my architecture looks like this:
PLC
 ↓
collector
 ↓
ClickHouse
 ↓
inference service
 ↓
event detection
 ↓
Flask dashboard
 ↓
event log
 ↓
matching against actual defects
That is, data constantly comes from real equipment, goes through the already existing pipeline, and the ML service simply connects to this stream as another consumer.
So far, there are no commands back to the equipment. AND THERE WON'T BE.
First, the model needs to live next to the machine for a while. Accumulate events: errors, confirmed defects, or just alarms.
And most importantly, see if the discovered patterns repeat not only on the historical dataset but also on new data.
And only after all this can we even discuss any hypothetical impacts.
For example:
ML detected a problem
        ↓
suggested a response to the operator, who made the decision
And someday much further down the line:
ML detected a problem
        ↓
the system made the decision and adjusted the process autonomously
But reaching that far is not only foolish but also dangerous (risk of harming production).
Conclusion
When I first started this task, the scheme in my head was like from textbooks: gather data, train a model, predict data. Easy?
But in real life, the main difference from Kaggle datasets is that we cannot be 100% sure of the model's predictions. Simply because it was trained on historical data, and today it sees possibly a completely different machine behavior. No one can guarantee us that the equipment will behave similarly to the historical data. Even if we spent a year collecting data. A year later, the production process could change, the machine could degrade or, on the contrary, receive maintenance. Any unpredictable impacts in the real world could turn our ML experiment with data in a notebook into just a joke. Worse — into a dangerous incident that could damage expensive equipment.